We were hired by the Stupski Foundation, in collaboration with the Bill and Melinda Gates foundation, in 2007 to help them create a knowledge management and visualization system that could visualize the big data that a school district generates about its entire ecosystem over several years. This includes all the nuts and bolts of every school, student, bus, cafeteria, labor union action, public policy, curriculum development, student achievement, and so on.
Urban district reform has typically been hampered by the challenge of understanding the tremendous volume of data and the complexity of persistent district change. The CAIS Benchmarking Study was designed to improve this understanding through ethnographic research that maps the reform journey in three urban districts.
Over the course of 2 years, we worked closely with the Stupski Foundation to design, vet and iterate a large scale visualization system. It has highly inventive in 2007, as no one has ever been able to type into a system something like "show the impact of the labor strike of 2007 effect on the bus system..." The system would return not only a chronological view of events, but related strands that reverbrated out from that main strand to show contributary cause and effect.
From this tool, Districts were able to gain incredible insight as to where their systems were out of alignment and provided much faster district reform methodologies.

Project Management (bird's eye) Roadmap
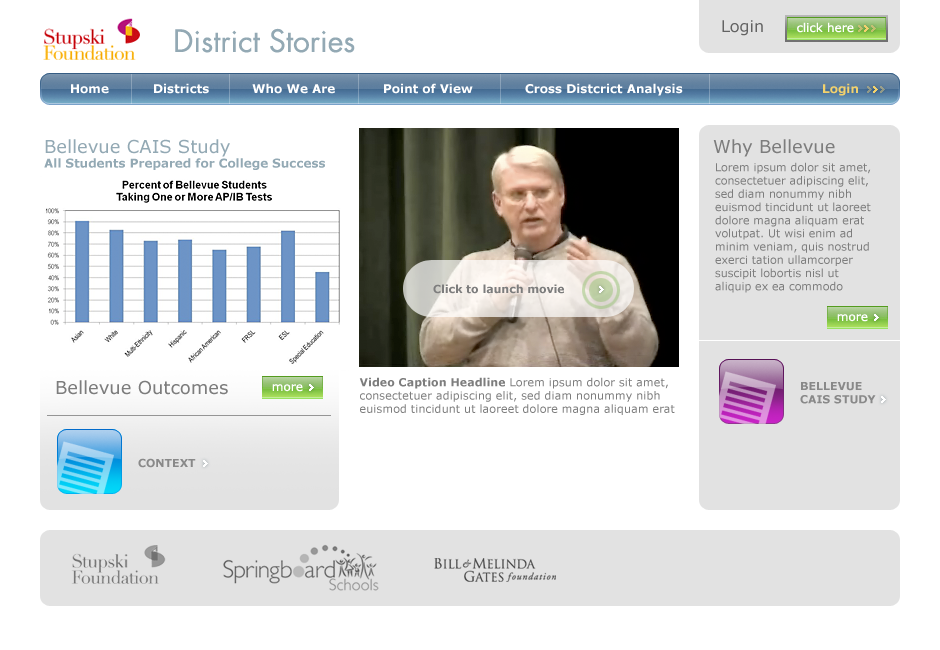
Main Public Website and access portal to the CAIS visualization application. The application was built in Adobe Flex running Cold Fusion server cluster.
One of the many typical multiple, 'all day' charrettes resulting in all four walls covered in paper.
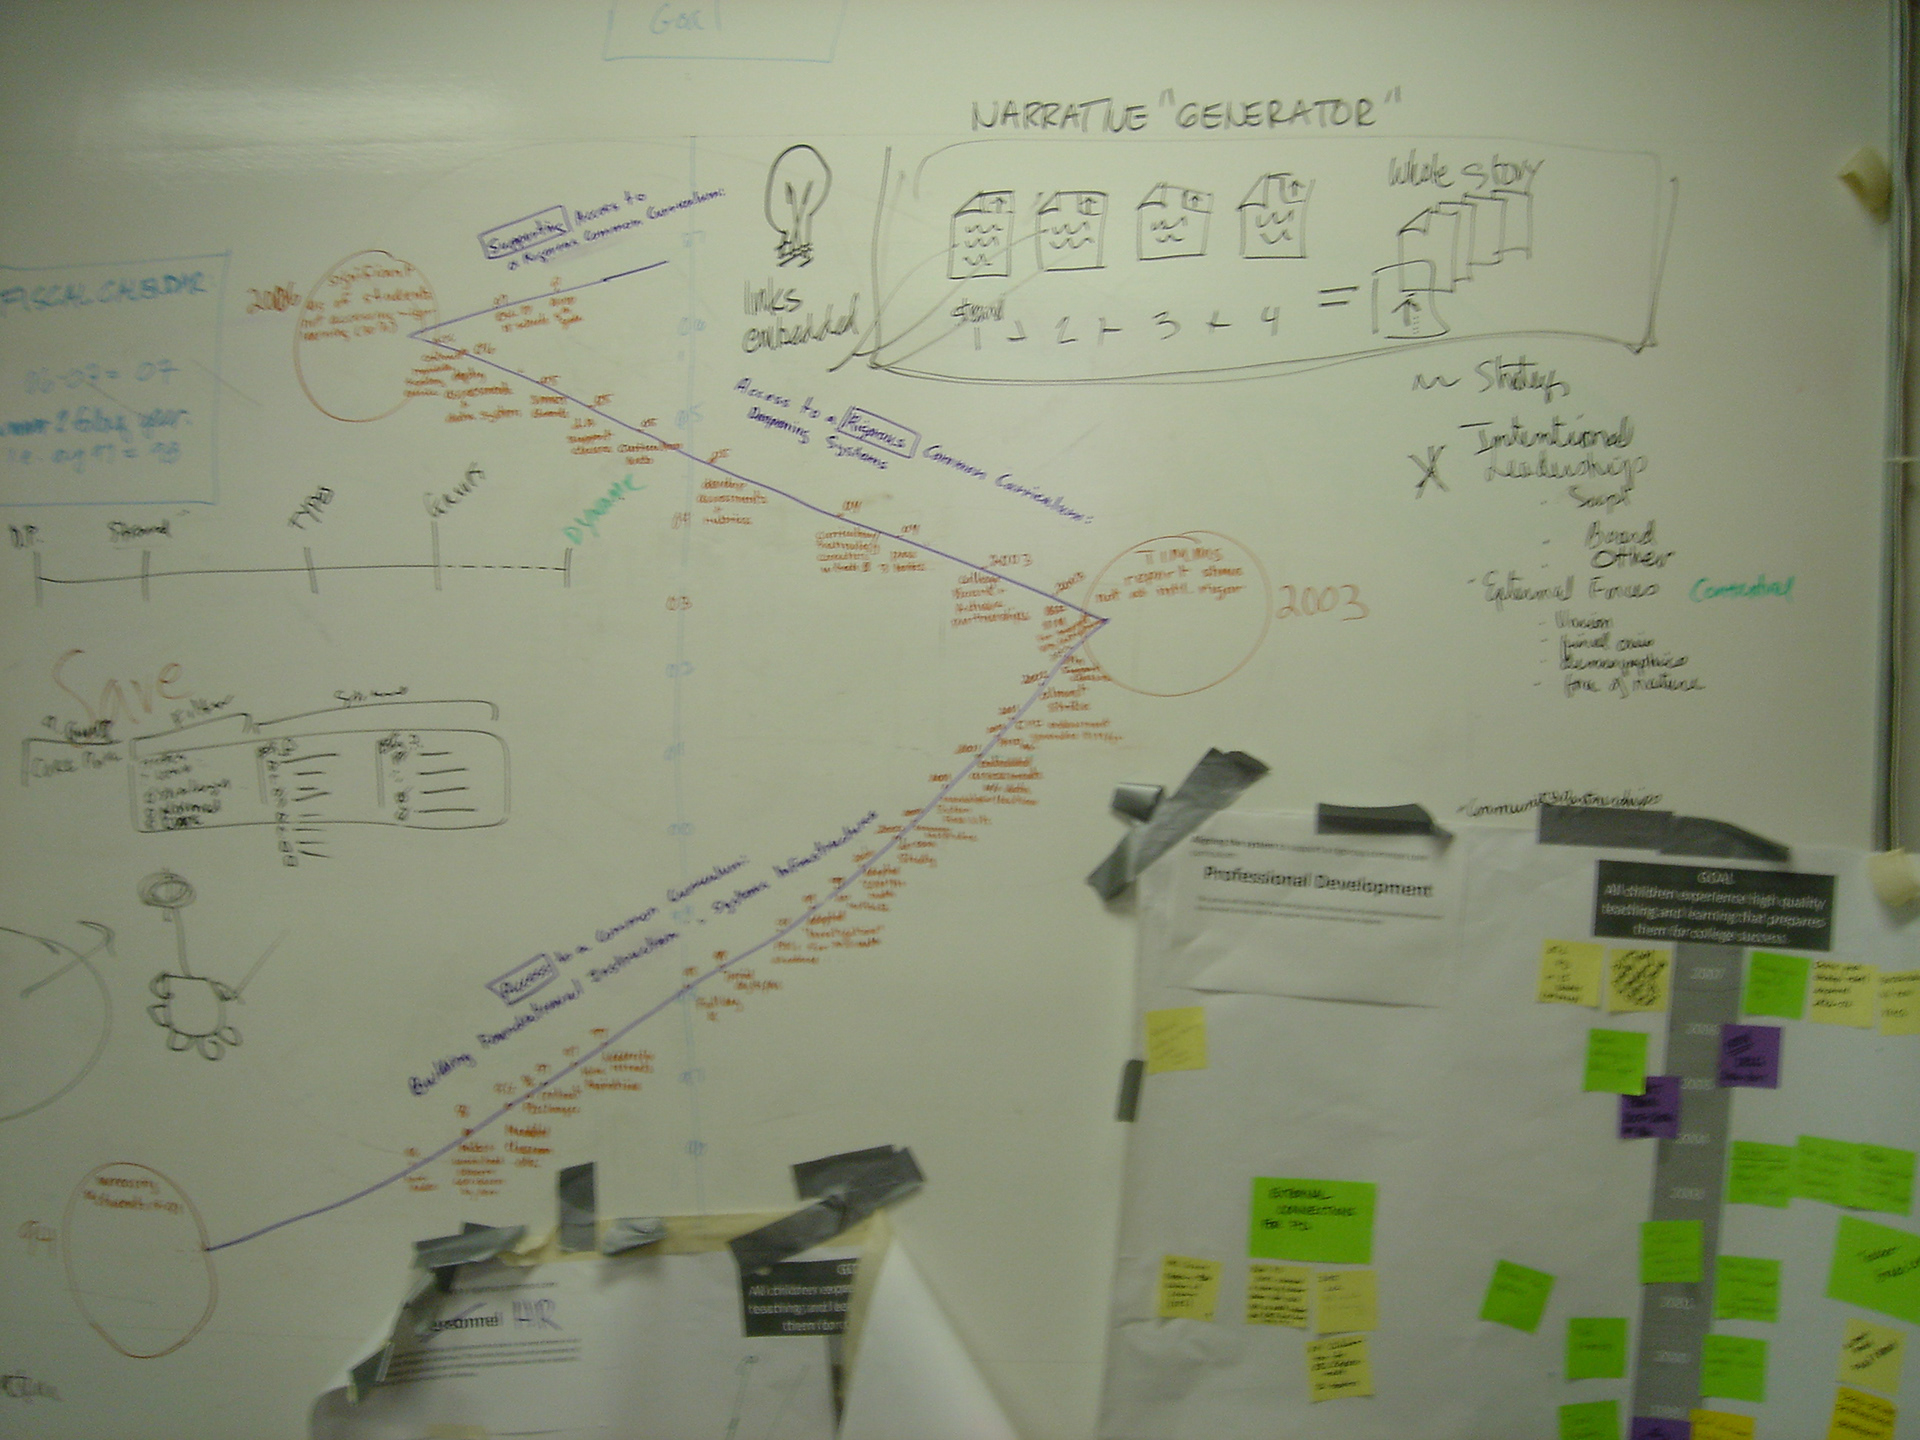
Typical design iteration being discussed and vetted for accuracy.
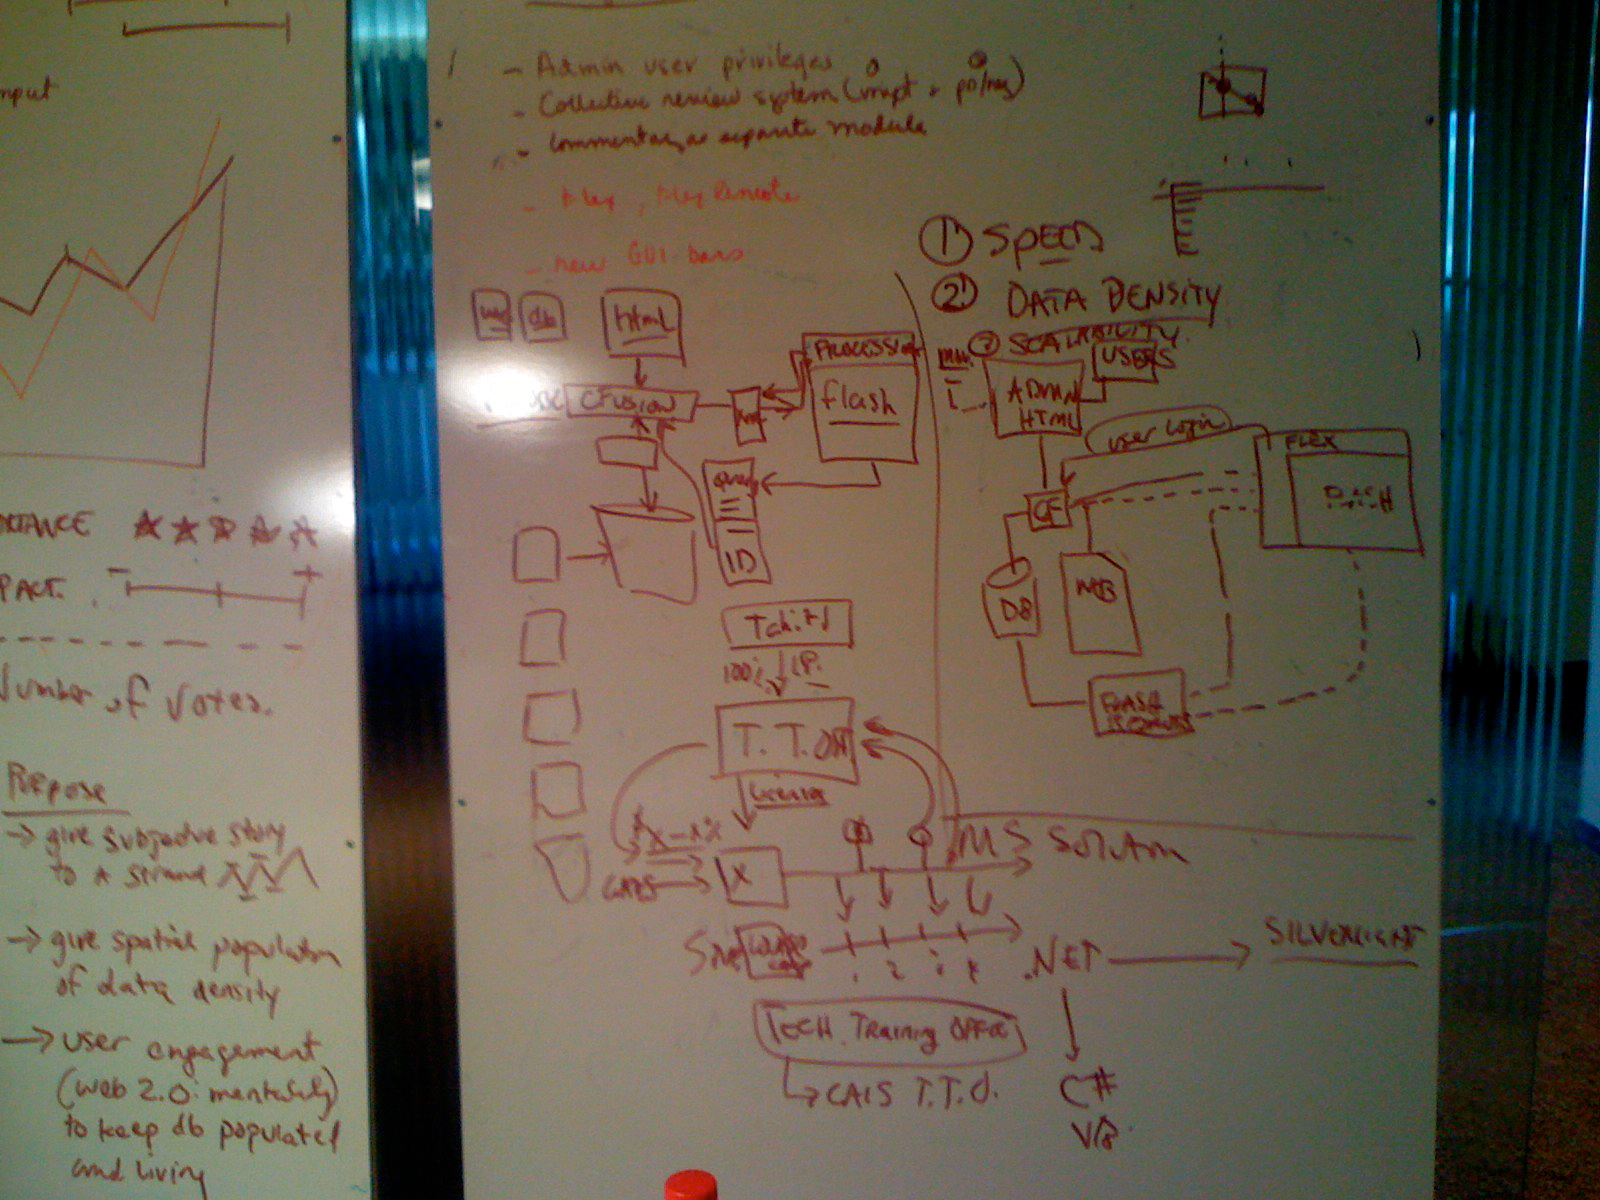
Translating education design speak into technical flowcharts that can be used by the developers to understand and accurately build what is required.
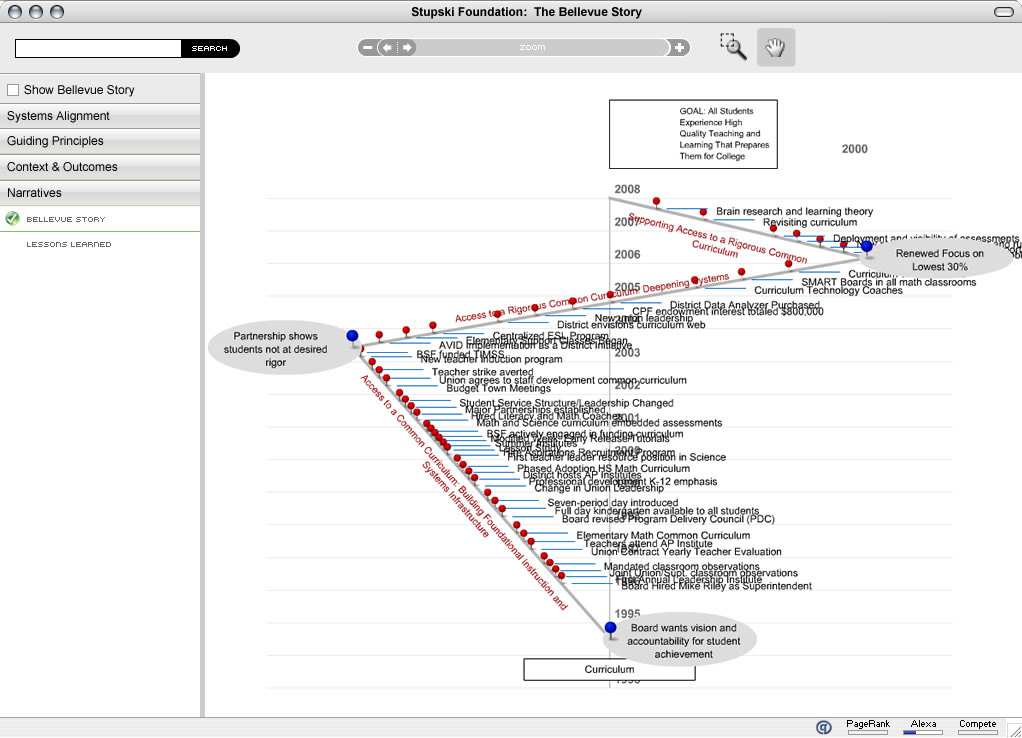
Prototype V1 running with in realtime with barebones GUI. It was important to see if the data was going to perform as expected.
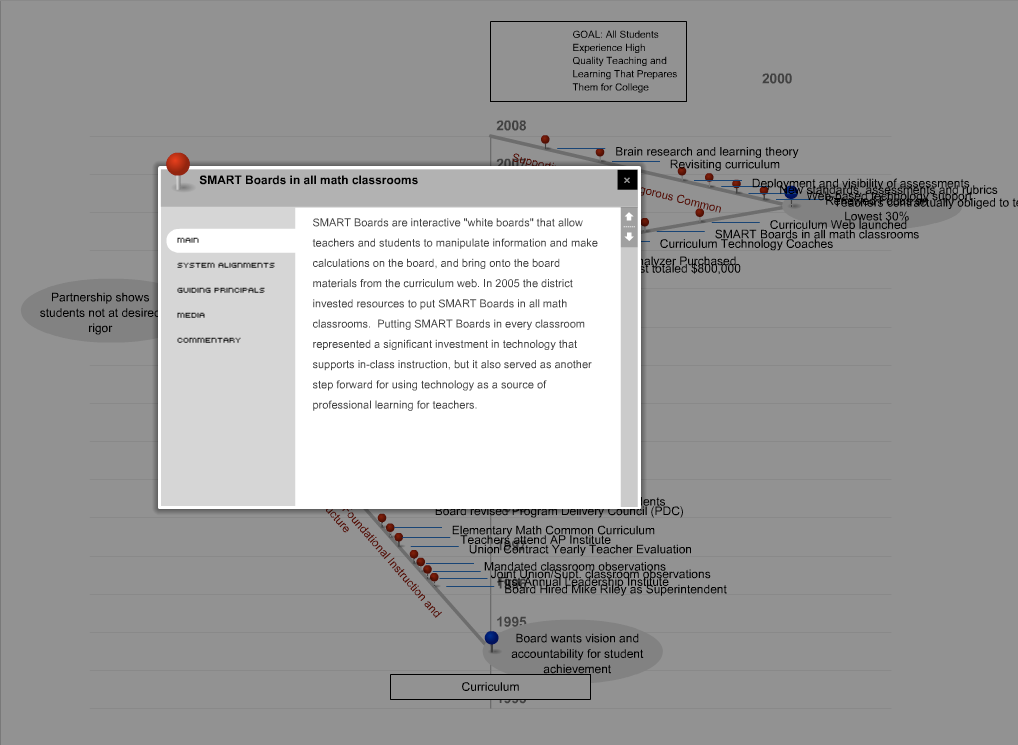
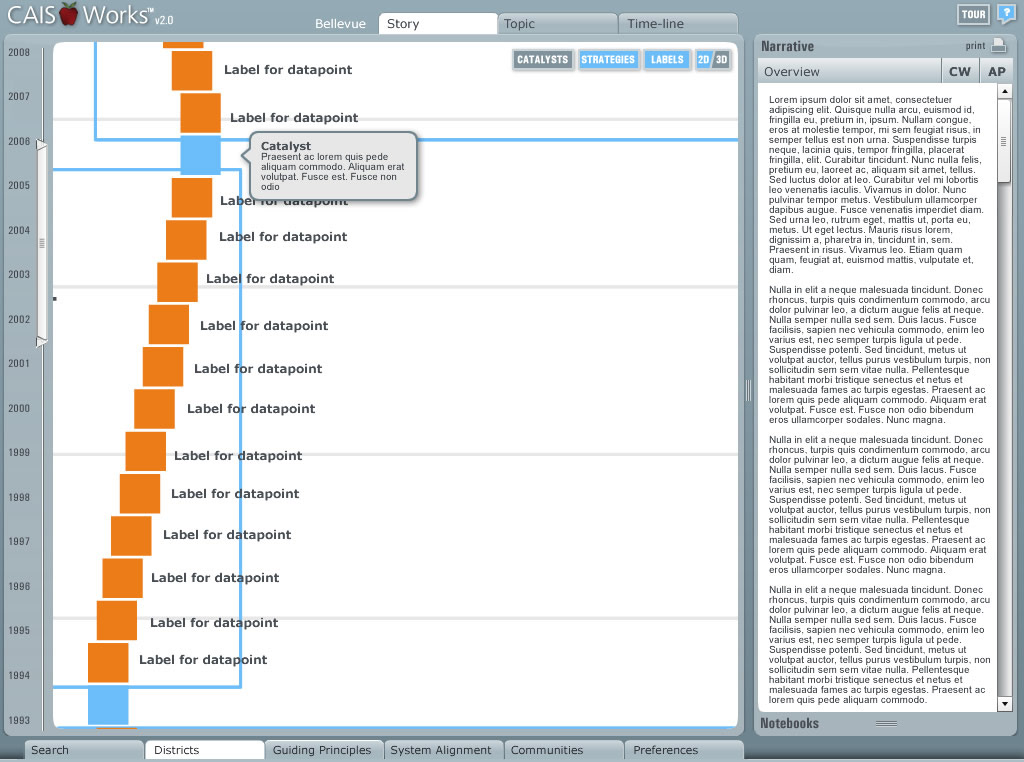
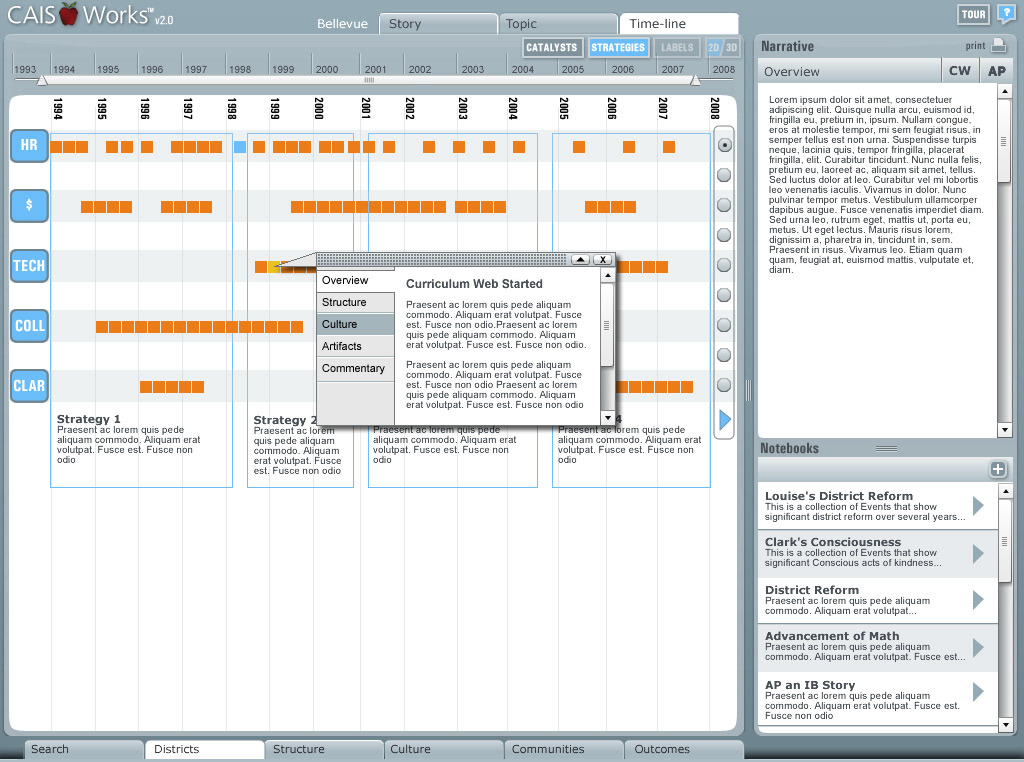
Simple annotation example of a datapoint with a couple of options.
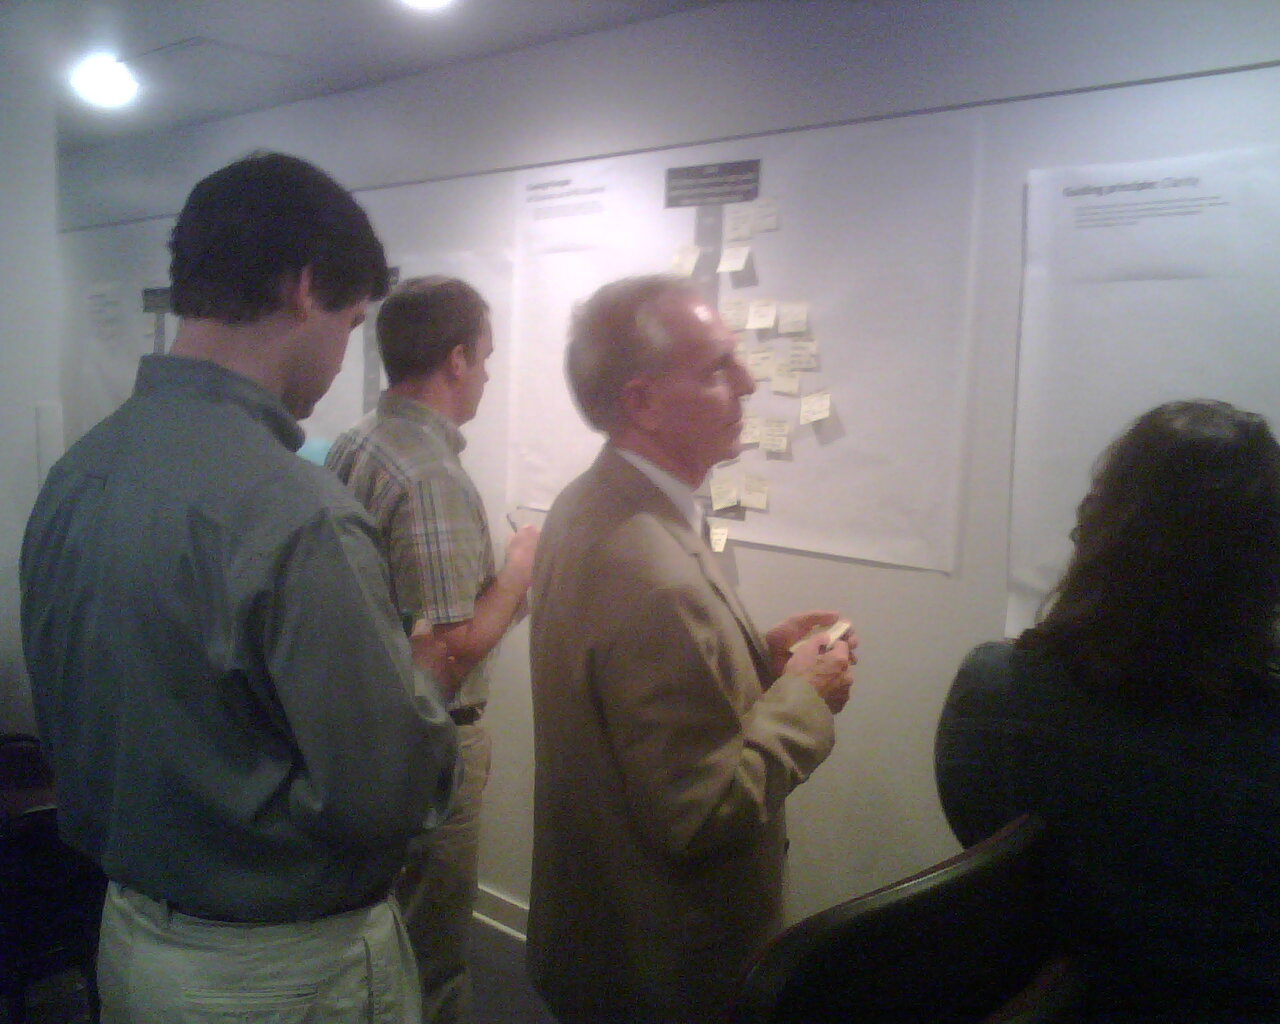
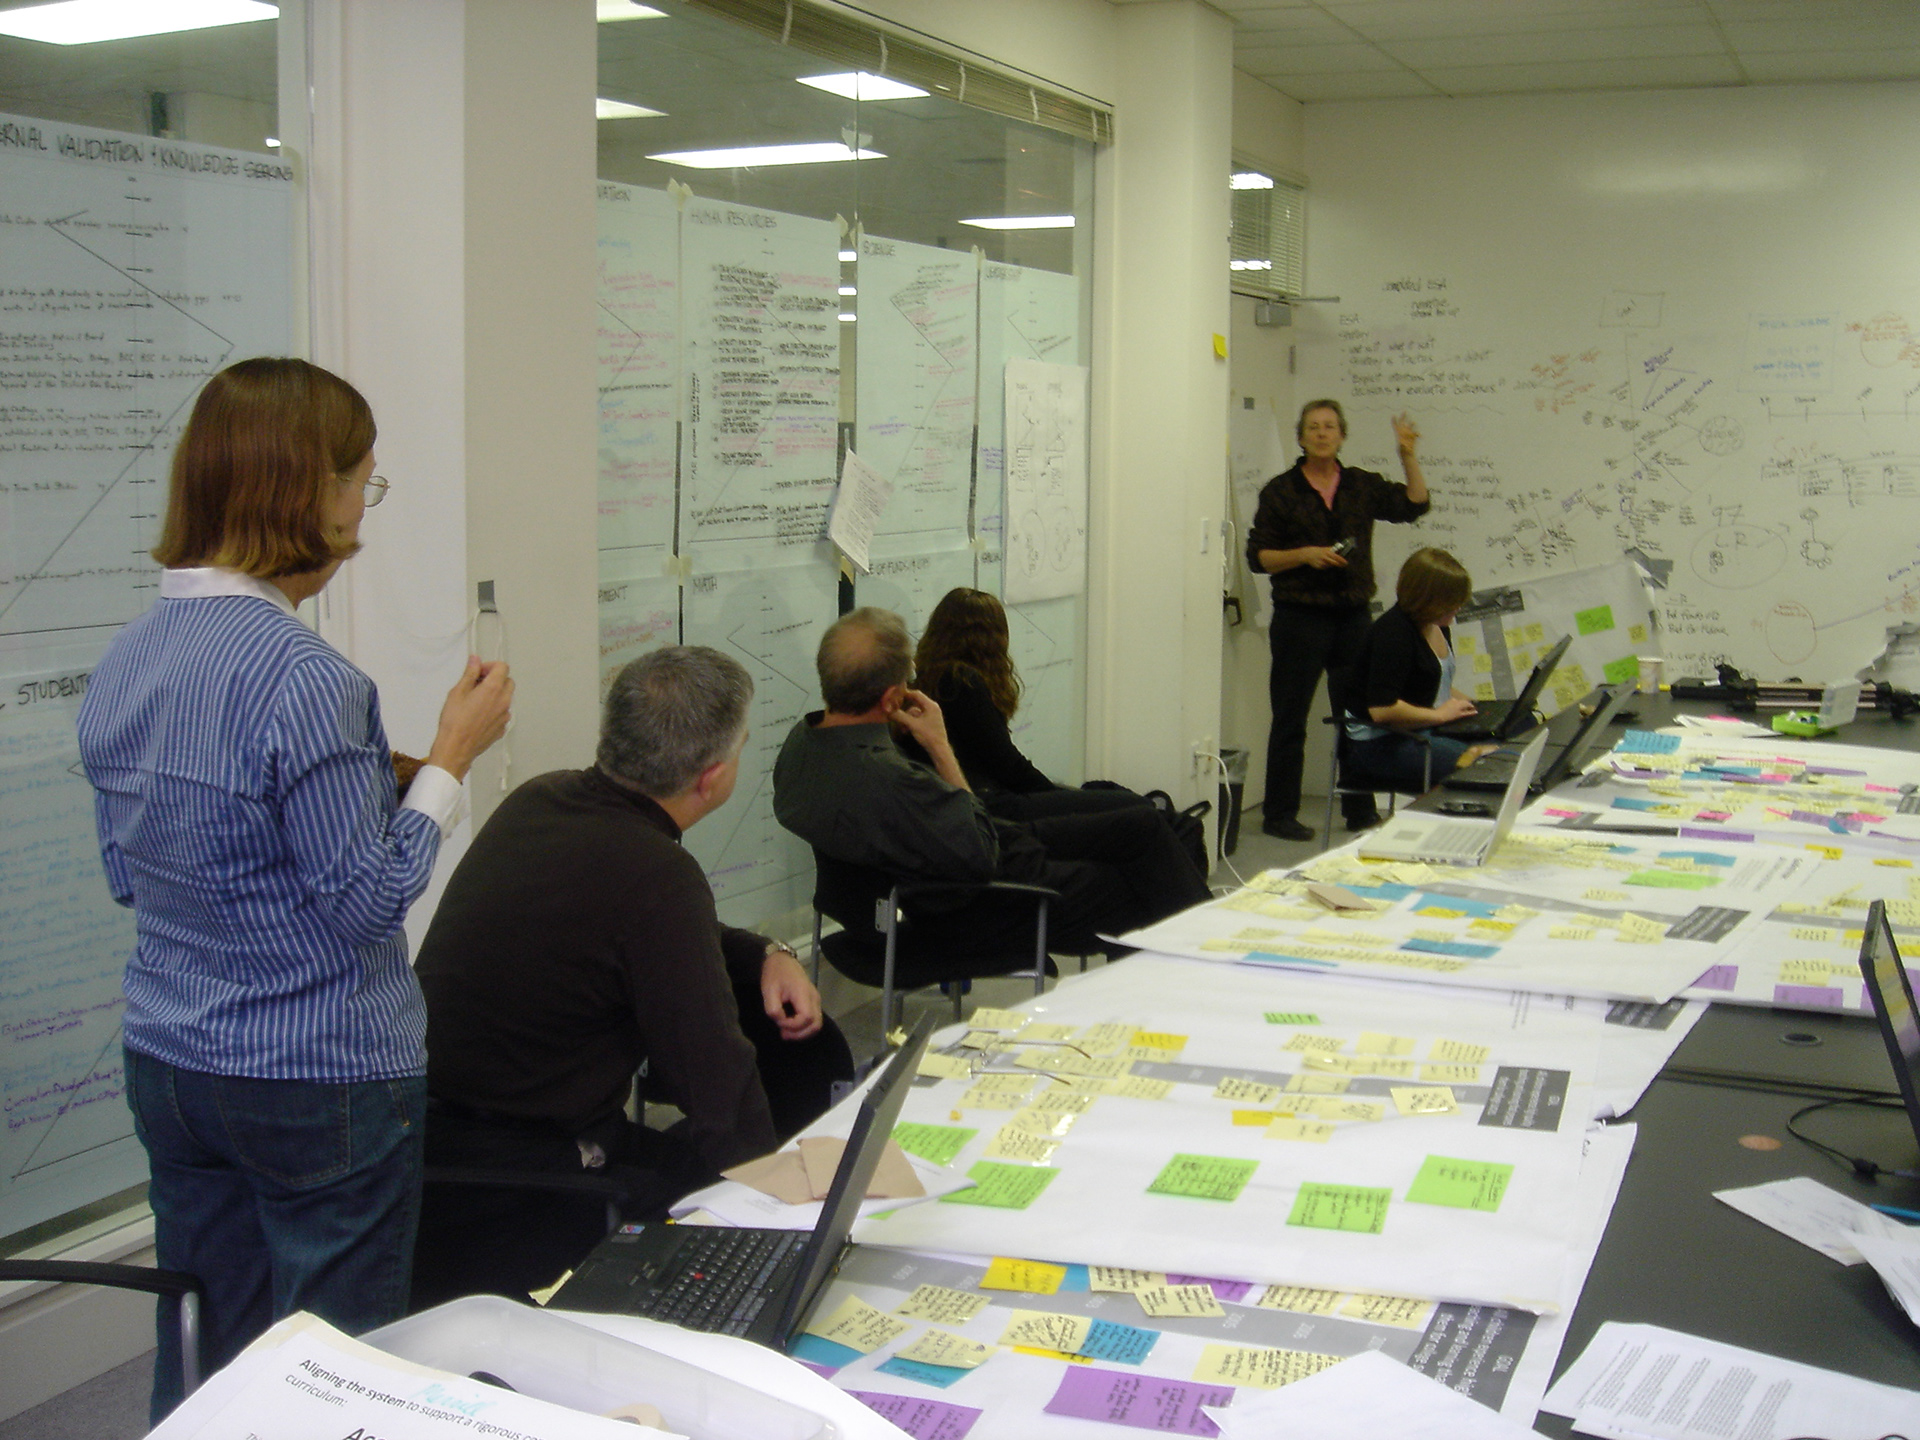
Data collection Charrette at the Bellevue, WA school district headquarters with all the key personnel and teachers present to populate the database. They were asked to view topics and put post-its on the board with any details they had about that topic.
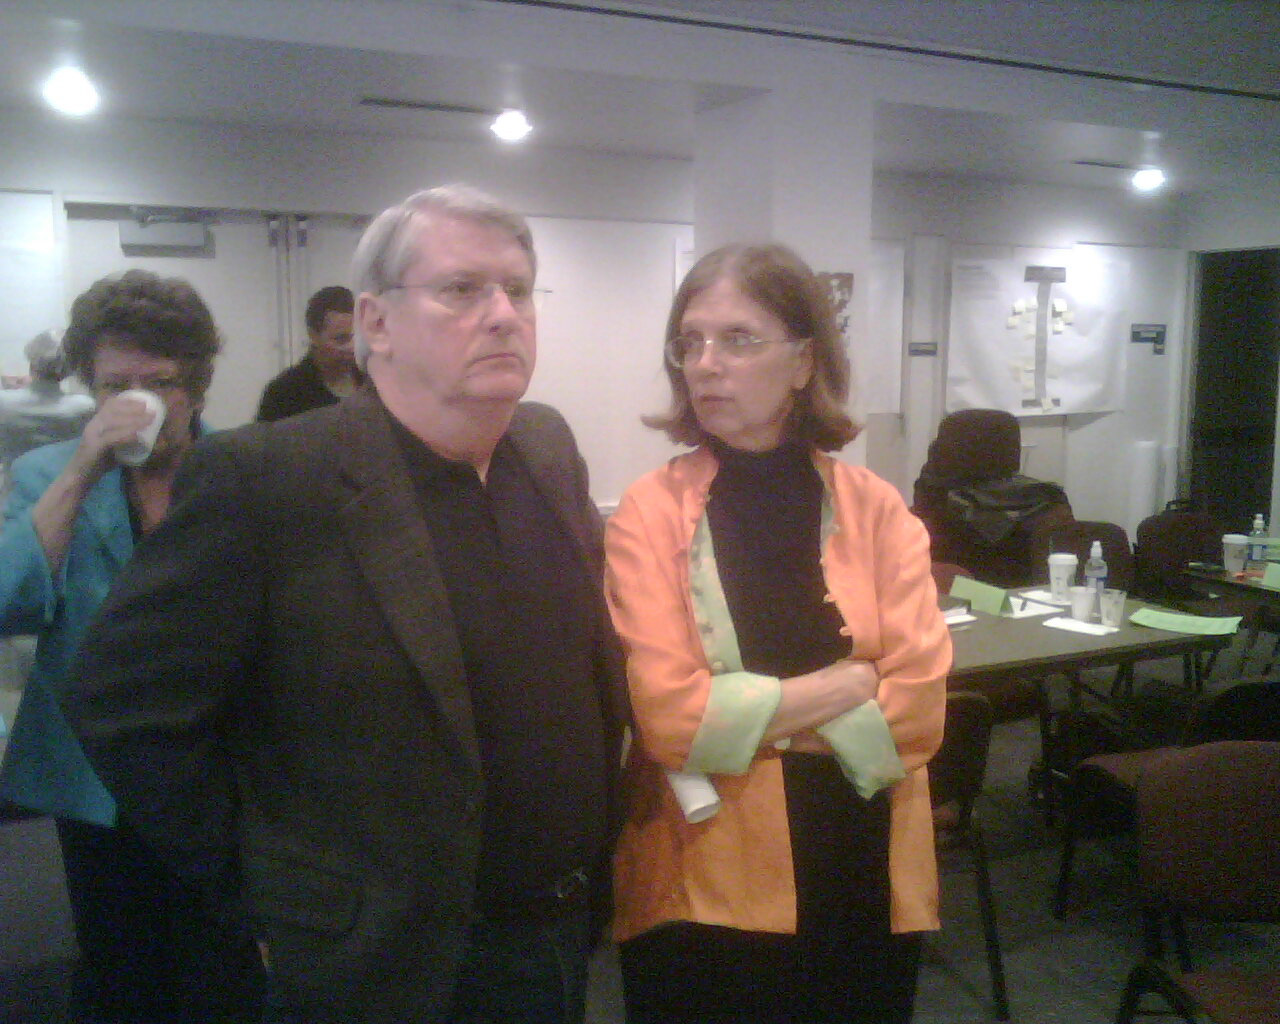
Clients Superintendent Mike Riley and Dr. Louise Waters overseeing the Charrette and confirming that the visualization system demo'd earlier that day was a huge success. The project then moved into phase two.
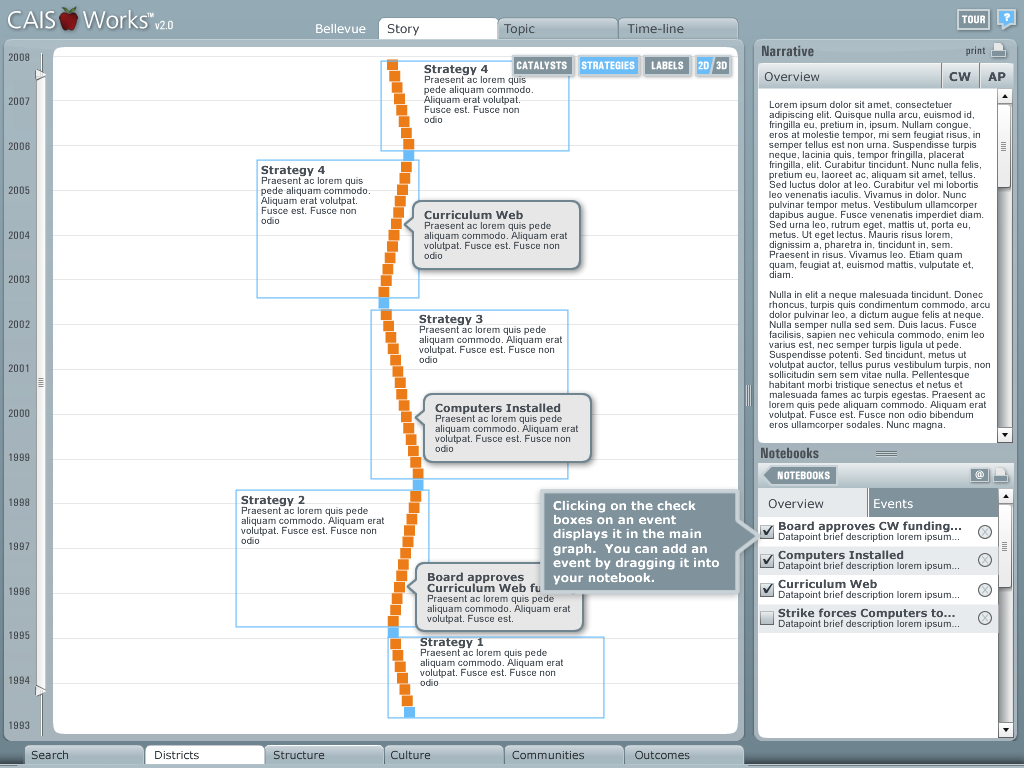
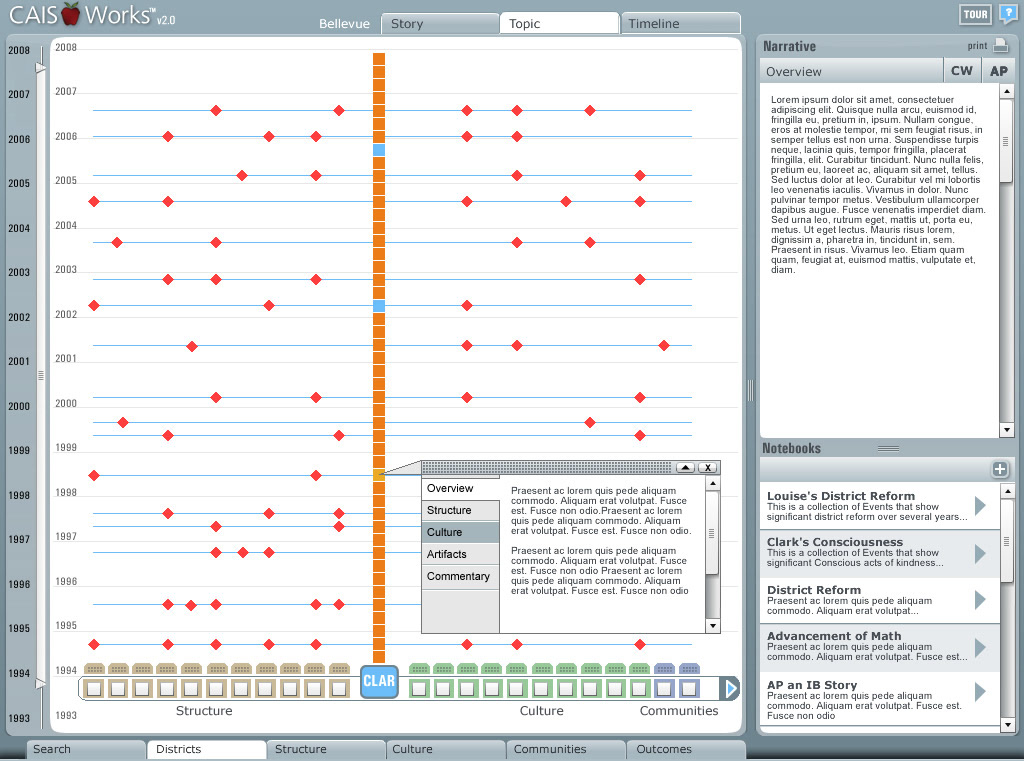
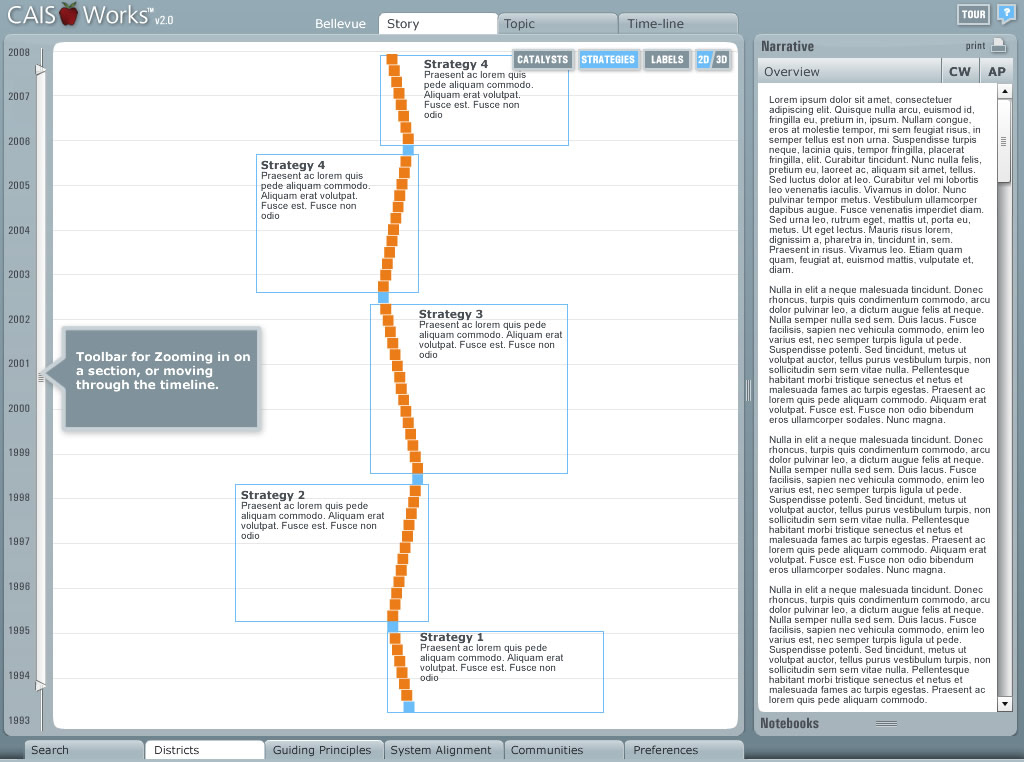
Version 2 of the system, with better GUI, UX, features and speed.

Views can be switched from 2D to 3D

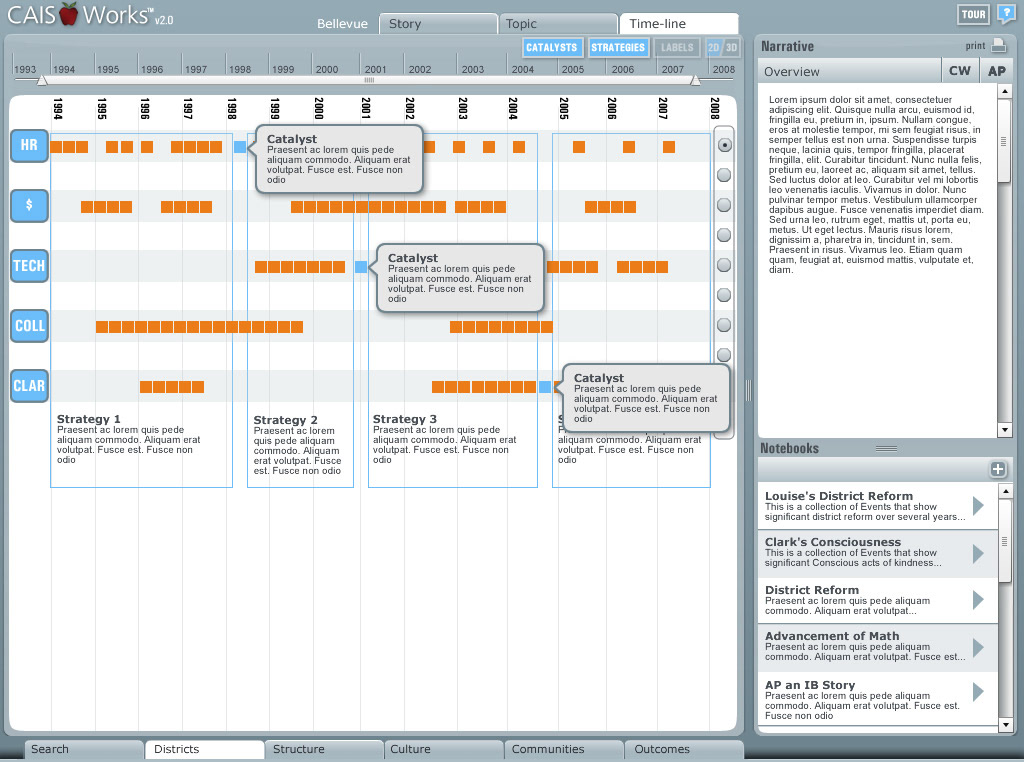
Views of a concept being inspected can be switched between views, from "Story", "Topic" and "Timeline" In this screenshot, the user has switched to "Time-Line" and is seeing the impact on HR, finances, technology, collaboration and clarity around the district's direction.
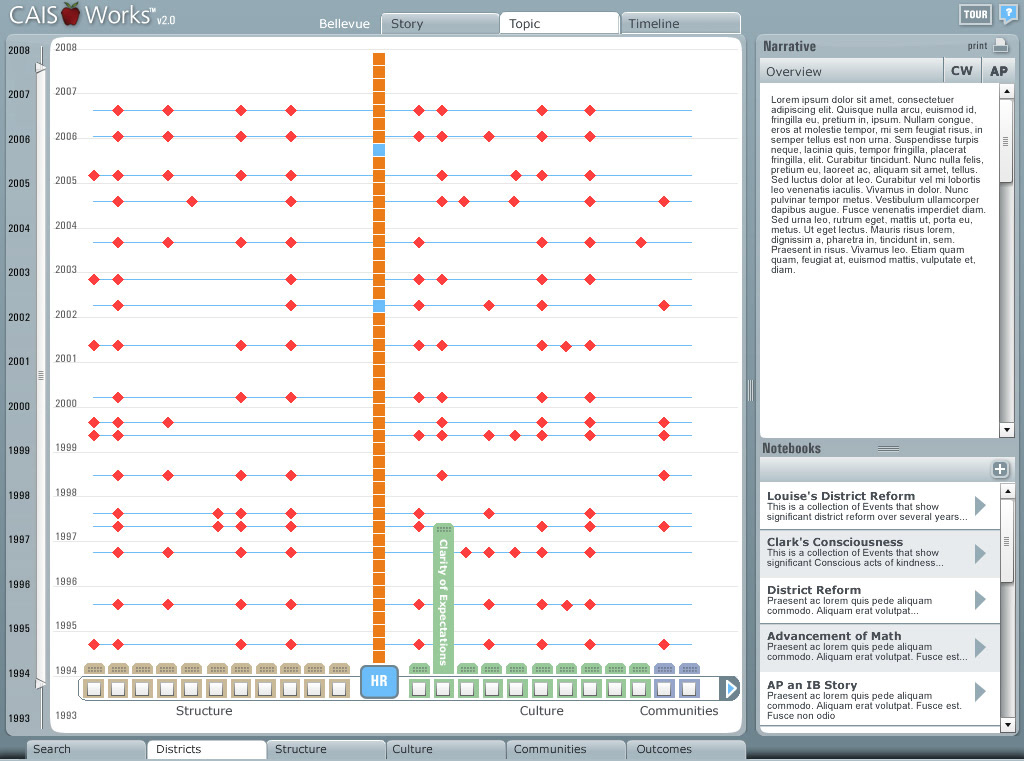
The "Topic" view allows the user to realign the stories into Topics and see how each topic impacts the story. The center line is the overall story, and immediately one can see to the left (Structure) or to the right (Culture) how the main storyline has been impacted by the related topics.